Metric Library
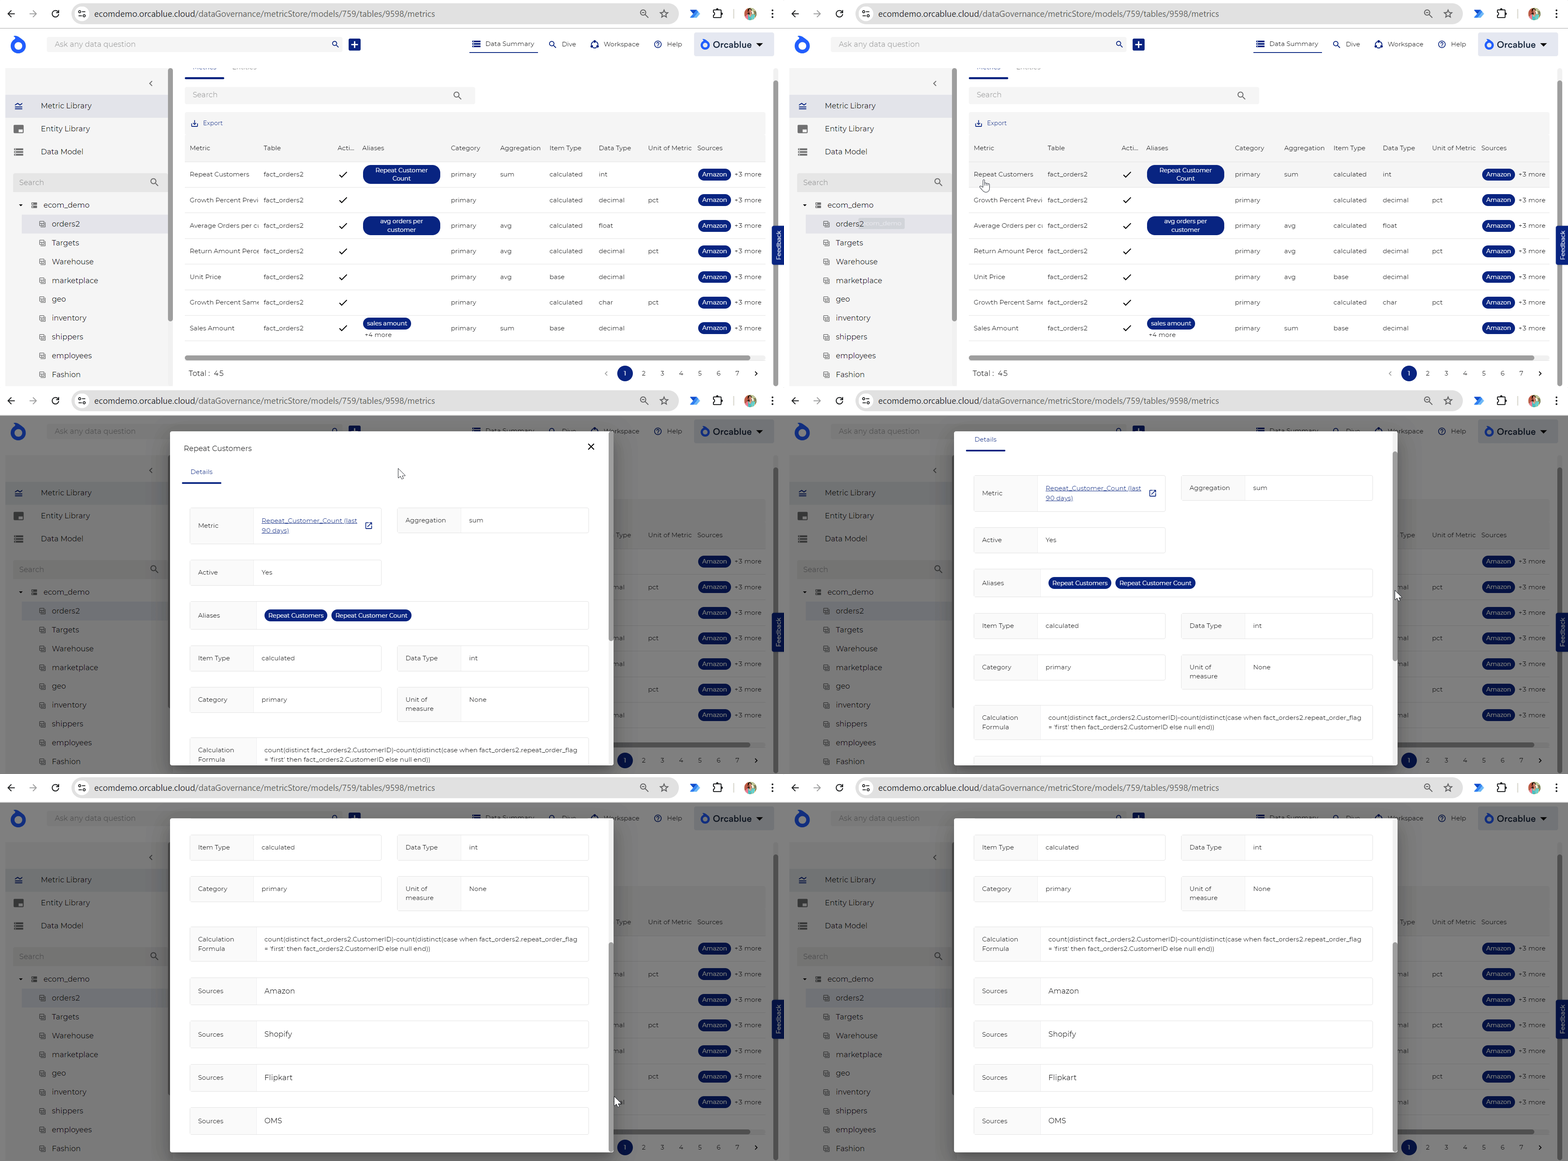
The Metric Library is your one-stop resource for managing all available metrics and KPIs. This section helps you access and understand the key measures in your dataset, providing detailed information to guide decision-making.
Understanding Metrics
A metric is a measure of quantitative parameter within your business process. For example, a metric like "Daily Trade Volume" measures the daily trading activity on an exchange. Metrics are designed based on business needs to track performance and help identify trends or issues.

Viewing Metrics
To explore metrics, simply select a dataset or metric group from the navigation panel. This will display a comprehensive list of all metrics in that dataset.
Detailed Metric Information
For each metric, detailed information is available, including:
- Aliases: Alternative names or descriptions of the metric.
- Aggregation: Defines how the metric is aggregated (e.g., sum, average, minimum, or maximum).
- Category: Whether it’s a primary or secondary metric.
- Table: The dataset in which the metric resides.
- Item Type: Indicates if the metric is Base (directly from data) or Calculated (computed in real-time).
- Data Type: The format of the metric (e.g., float, decimal, or text).
- Calculation Formula: Formula used to calculate the metric (for calculated metrics).
- Data Sources: The origins of the data contributing to the metric.
Using Metrics for Visualizations
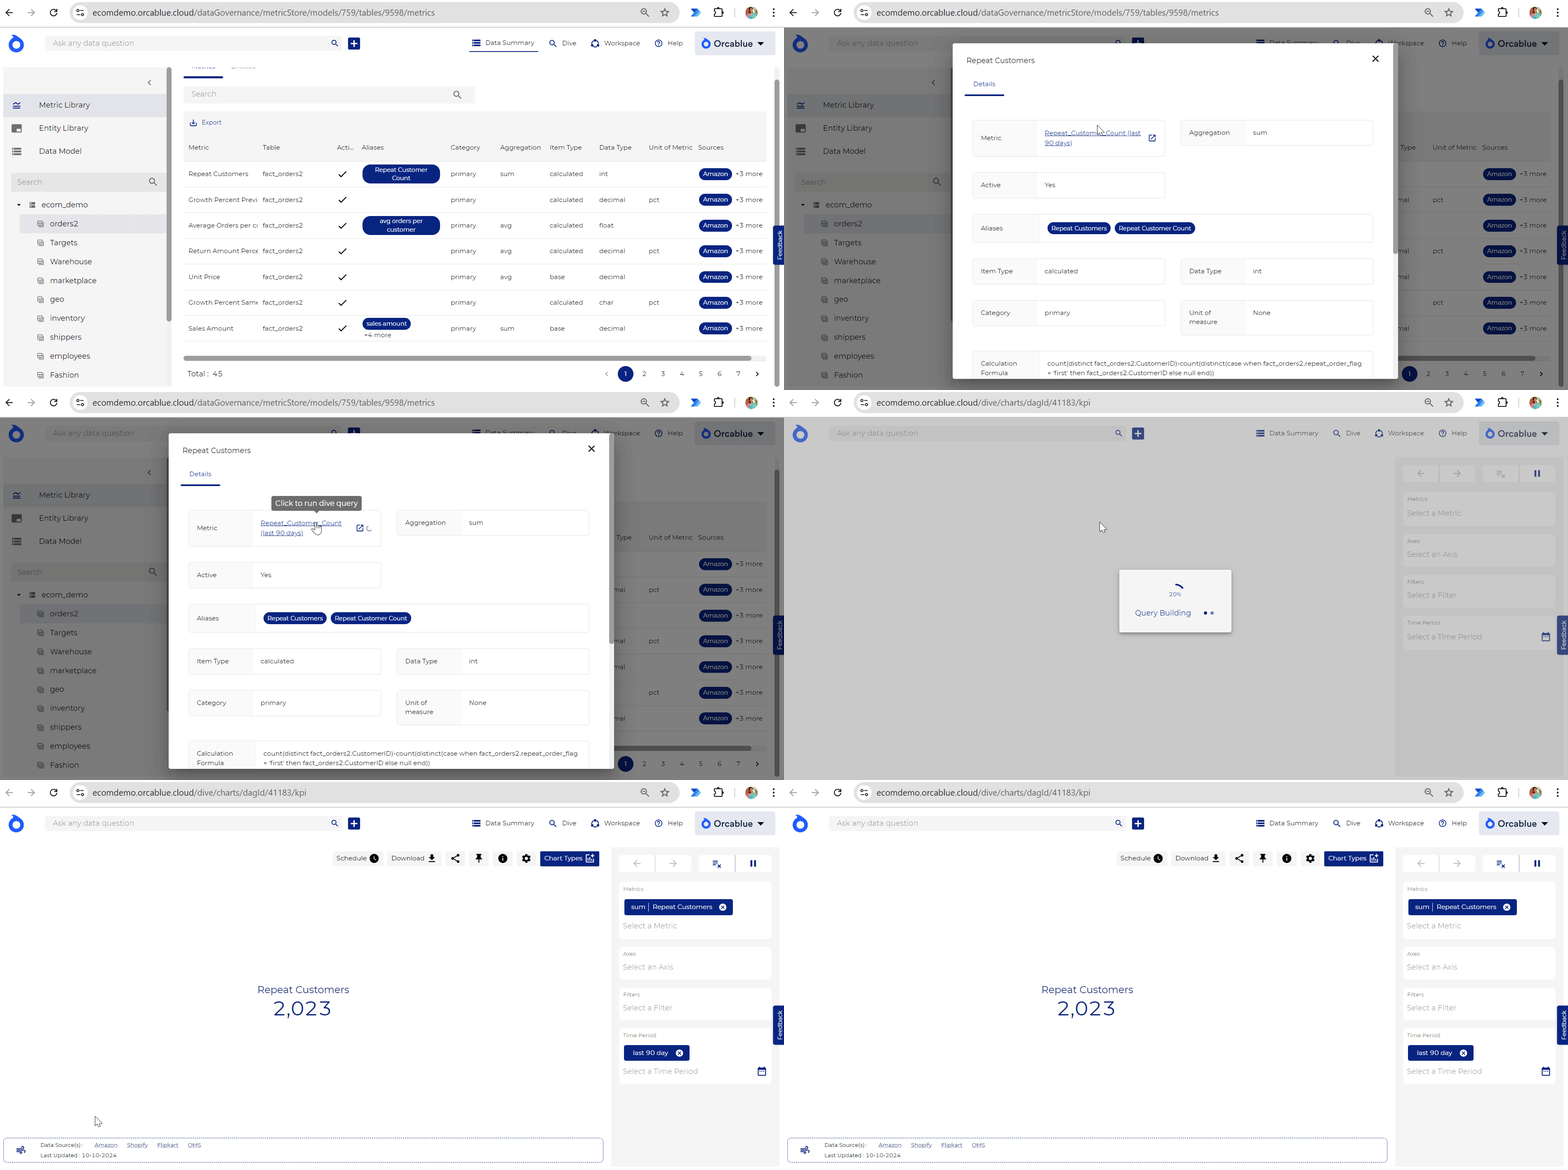
Once you've selected a metric, you can run queries and generate visualizations directly within the interface. Orcablue enables you to create insightful visualizations quickly, allowing you to build impactful charts and dashboards with ease.
